

Reporting & Analytics applications.
Turn raw data into reports and insights your team can act on—automated, accurate, and easy to share.
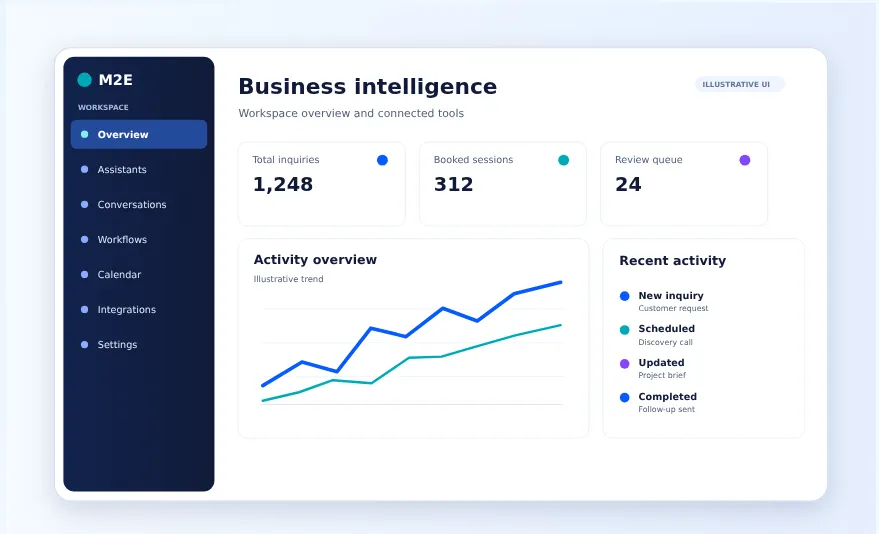
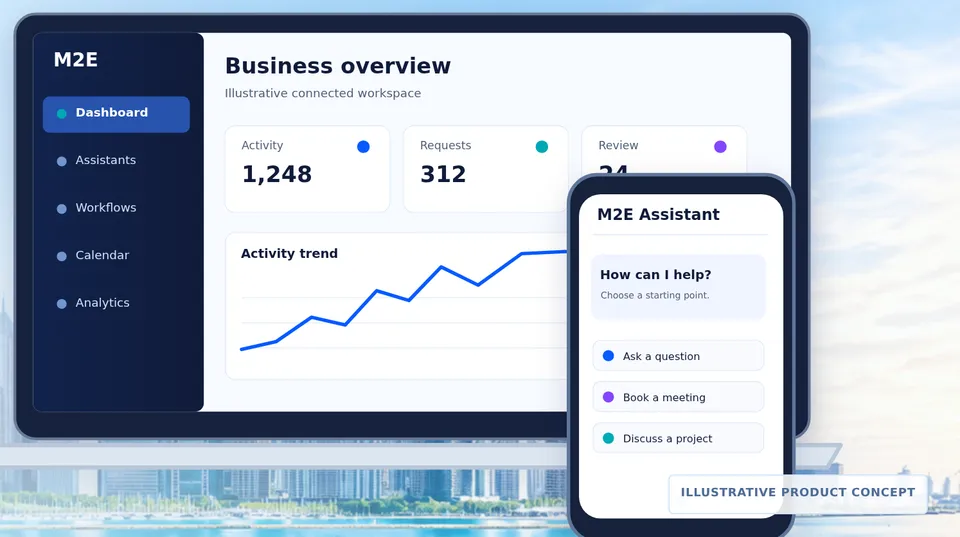
Stop building reports by hand.
We automate the collection and calculation behind your reports, then deliver them through dashboards, scheduled emails, or exports.
- Data collection and cleanup
- Scheduled and on-demand reports
- Role-based access to results
Reporting features.
Visual Reports
Charts and tables.
Scheduled Delivery
Reports sent automatically.
Exports
CSV, Excel, PDF.
Filters
By date, team, location.
Alerts
Notify when numbers change.
AI Summaries
Plain-language highlights.
From first conversation to what’s next.
Discover
Define the problem, users, and goals.
Prototype
Visualize key screens and workflows.
Develop
Build to the agreed scope.
Launch & evolve
Go live, support, and keep improving.
Common questions
How much does a web-based application cost?
Applications are quoted after discovery because cost depends on functionality, not page count. Interactive prototyping starts at $999.99 for up to 15 screens; that covers prototyping only, not full development.
Do you offer zero-down development?
Zero-down development is available for qualifying projects only. See zero-down development.
Who owns the application?
Ownership, licensing, and hosting terms are defined in your agreement before development begins.

Let’s build what your business needs.
Tell us what you’re imagining. We’ll help identify the right prototyping and development starting point—without guessing at an application price.
Free discoveryTalk through your goals and requirements.
Visualize your ideaInteractive prototypes from $999.99.
Build with clarityReceive a scope-based development quote.